

Study sample
This study retrospectively selected individuals who underwent PFT and CT examinations at the Fourth Clinical Medical College of Xinjiang Medical University from January 2018 to July 2024. We collected CT images, PFT parameters, demographic information, and clinical details for each participant. To ensure the correspondence and comparability of imaging information and physiological parameters in predictive analysis, the average time interval (± standard deviation) between PFT and CT examinations in this study was 15 ± 7 days. The inclusion criteria were defined as follows: patients diagnosed with COPD who had complete clinical data, PFT results, and chest CT imaging data. The exclusion criteria included the following: (1) Medical records could not be accessed for the individual. (2) The individual had a cardiac stent, pacemaker, or metallic foreign body. (3) Concurrent diseases (e.g., extensive bronchiectasis, pulmonary tuberculosis, lung tumors, prior lung surgery, massive pleural effusion, or pulmonary consolidation) were present that could impair image quality. (4) Cases were identified as outliers and contained incomplete data. (5) CT images had unaligned voxels. The study ultimately included 2,408 participants. 822 eligible cases were used for encoder training to extract CT image features, and 1586 cases were used for the development and validation of the subsequent fusion model prediction of PFT parameters. The detailed process is shown in Fig. 1.
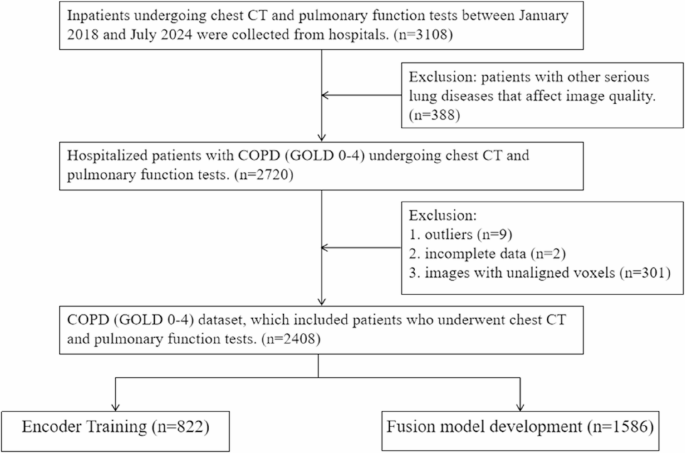
Inclusion and exclusion criteria for the data set
Pulmonary function test
The 1-s forced expiratory volume (FEV1), forced vital capacity (FVC), 1-s forced expiratory volume ratio forced vital capacity (FEV1/FVC), 1-s forced expiratory volume to predicted value (FEV1%), and forced vital capacity to predicted value (FVC%) were measured using the CHESTAC-8800 pulmonary function analyzer. Due to the insufficient number of participants with post-bronchodilator PFT, pre-bronchodilator PFT parameters were used in this study.
Chest CT examination
In this study, the Definition Flash 64-slice dual-source spiral CT equipment was used for scanning. The patients were in the supine position, and the scanning range covered the entire lung area from the apex to the base. The scanning parameters were set as tube voltage 120 kV, tube current in the automatic adjustment mode, and the acquisition matrix was 512 × 512. The lung window was set with a window width of 1200 HU and a window level of -600 HU, which focused on displaying the CT image information with HU values in the range of [-1200, 0]. To ensure the quality of the image data, only thin-slice CT images with a scan layer thickness of ≤ 1 mm were included. These images have higher spatial resolution. The final images were stored in DICOM format. All CT image acquisition and processing processes were anonymized to effectively protect patient privacy and security.
Image preprocessing
In the medical field, the preprocessing of CT images is essential to highlight disease foci and optimize model performance [14]. Before building the model algorithm, we preprocessed the CT images. The primary goal of this preprocessing pipeline is to enhance the accuracy and reliability of model predictions by ensuring clean and consistent input data. In this experiment, the PyTorch-based MONAI framework was used for image preprocessing, and the process included five steps: image segmentation, image resampling, data enhancement, CT value normalization processing, and radiomics feature extraction. See supplementary materials for details.
Model construction and training
In the crossover research of medical image analysis and DL, this study first used the DenseNet model based on CNN as an encoder to extract deep features from chest CT images, which can effectively retain and transmit the spatial structure information and pathological features in the images. Subsequently, to fuse the CT image features extracted by the encoder with demographic data (such as age, gender, smoking history, etc.) and radiomics features (such as intensity features, morphological features, texture features, etc.), a multimodal feature fusion model based on Multilayer Perceptron (MLP) was constructed to achieve the purpose of multi-source information joint representation.
DL architecture
The core part of our multimodal feature fusion model mainly consists of three parts. The first part is the independent feature transformation layer, which is used to process image features and clinical data separately. The second part is the gated network layer, which is used to dynamically generate feature weights for each target. The third part is the goal-specific prediction head layer, which is used to perform regression predictions for different targets. The specific architecture of the model is shown in the supplementary materials.
Experimental setup
The DL model was trained using the training set data, and the Adam optimization algorithm was used to minimize the loss function between the predicted value and the real PFT value as Smooth L1 Loss. The fixed learning rate was 0.001, the maximum epoch was 100, and the batch size was 64. During the training process, record the performance indicators of the model on the training set and the validation set to observe whether overfitting occurred. After the training was completed, the final evaluation of the optimized model was performed using ten-fold cross-validation, and the performance indicators of the model were calculated.
Statistical analysis
Data analysis was conducted using SPSS 26.0 software. All measures (age, height, weight) were expressed using mean ± standard deviation, and count data (gender, smoking history, GOLD stage) were expressed using the number of cases (percentage).
The study used Python 3.10 to calculate the average performance indicators of the model, such as the mean absolute error (MAE), the mean squared error (MSE), and the Pearson correlation coefficient (r), to evaluate the stability and generalization ability of the model. To rigorously evaluate the robustness of the model, a ten-fold cross-validation strategy was adopted for the entire fusion prediction system (focusing on the MLP fusion model). Bland-Altman plots were plotted to analyze the mean difference between the predicted and measured values. Classification performance based on model-predicted thresholds versus clinically established cut-offs was assessed as area under the receiver operating characteristic curve (AUC), accuracy, sensitivity, and specificity. Gradient-weighted class activation mapping (Grad-CAM) [15] was used to generate heat maps to visualize areas of information in chest CT images and explain the model prediction process.
link